Enhancing object detection capabilities in self-driving vehicles by using DataRobot Visual AI
- Angel Solutions (SDG)

- Oct 7, 2024
- 6 min read
Updated: Jul 2, 2025
Object detection plays a pivotal role in autonomous vehicles, where split-second decisions can mean the difference between safety and disaster. DataRobot Visual AI, a cutting-edge platform, revolutionizes this critical task by delivering unparalleled accuracy and efficiency. This blog post delves into the capabilities of DataRobot Visual AI for object detection, showcasing its potential to transform the self-driving car industry.
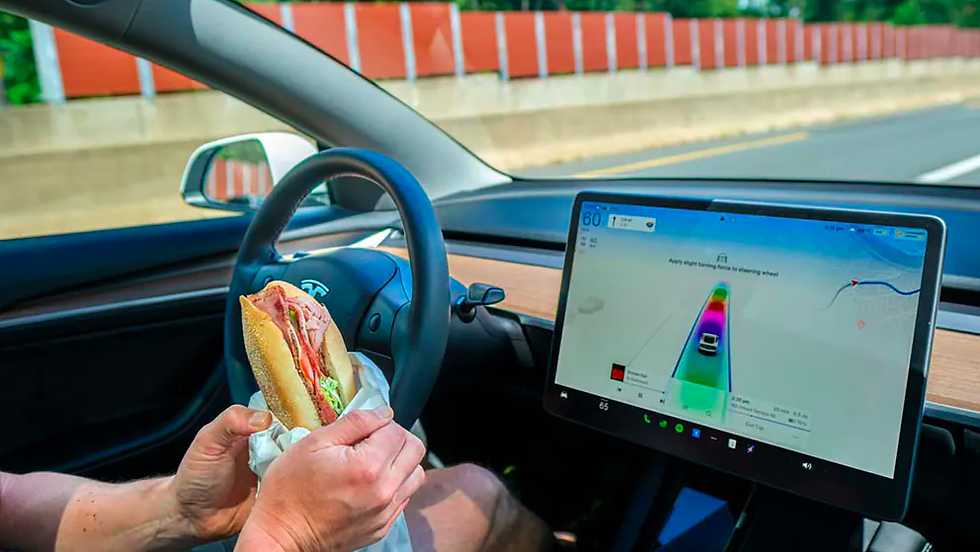
DataRobot Visual AI empowers users to unlock the valuable information hidden within images. Automating feature extraction and seamlessly integrating with other DataRobot tools makes image-based AI accessible and effective for a wide range of applications, from object detection and classification to defect detection and image similarity. With Visual AI, businesses can gain a deeper understanding of their operations, improve decision-making, and drive innovation.
Understanding Object Detection for Self-Driving Cars
Object detection is crucial for self-driving cars. It's the technology that allows these vehicles to "see" and understands their surroundings, identifying pedestrians, other vehicles, traffic lights, cyclists, and obstacles in real time. This ability to perceive the environment is the foundation for safe and reliable autonomous navigation. Without accurate object detection, self-driving cars wouldn't be able to make informed decisions about when to accelerate, brake, change lanes, or react to unexpected events, putting passengers and other road users at risk.

Real-time object detection, especially in the context of autonomous vehicles, presents a unique set of challenges. These systems need to accurately identify and locate objects in dynamic environments with constantly changing conditions. This requires sophisticated algorithms that can handle variations in lighting, weather, occlusions, and viewpoints. Furthermore, processing this information in real-time demands significant computational power and efficient algorithms to avoid delays that could compromise safety. Ensuring reliability and robustness in diverse and unpredictable real-world scenarios is paramount for successful object detection in self-driving applications.
Preparing the Dataset
The dataset used for this use case is from Kaggle. It's an extensive dataset consisting of 22,241 photos of the camera installed on the car in different positions. Five classes or labels are considered: ‘car’, ‘traffic_light’, ‘person’, ‘truck’, and ‘bicycle’. It’s worth noticing the importance of the labeling process: accurate labeling ensures the AI understands what it's looking at.
High-quality data, well-prepared, free from errors and inconsistencies, prevents the AI from learning the wrong lessons or making inaccurate predictions. In essence, good labels and clean data are the foundation for a reliable and effective AI model. In this use case, the role of data preparation was particularly critical. We will dive deeper into data preparation topics in future posts.
Evaluating the Model's Performance
After careful consideration, the model Light Gradient Boosted Trees Classifier with Early Stopping (SoftMax Loss) (64 leaves) was selected from the DataRobot Leaderboard. The image below depicts the model’s Lift chart.

This Lift chart demonstrates that the chosen model excels at object detection for self-driving cars. It accurately prioritizes the most critical objects, significantly outperforming random selection. This translates to a safer and more reliable autonomous driving experience, as the vehicle can effectively perceive and react to its environment.
While the model performs well overall, the lift curve flattens out towards the end. This suggests there might be room for improvement in identifying some of the less frequent or more challenging objects.
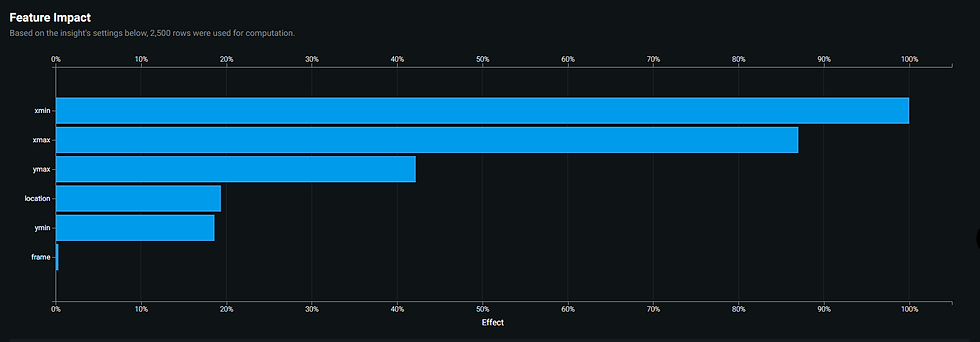
The Feature Impact chart, shown in the image above, highlights the critical role of accurate object localization and size estimation in your self-driving car object detection model. The bounding box coordinates and object area are the primary drivers of accurate detection, while the object's location within the image or video frame plays a lesser role. This understanding can guide further model refinement and data collection strategies, focusing on optimizing the accuracy of bounding box annotations and object size estimation to enhance the model's overall performance and reliability.
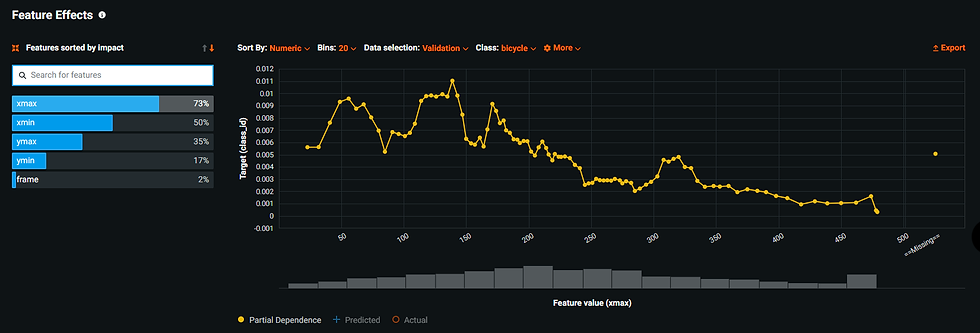
Considering the Feature Effects chart for the ‘bicycle’ class, illustrated in the image below, the Feature Effects chart reveals a complex relationship between the horizontal position of a bicycle in an image and the model's ability to detect it. While bicycles positioned toward the right side of the image are generally easier to detect, placing them too close to the edge can hinder accurate identification. This insight highlights the importance of considering object position and context within an image for robust object detection in self-driving car applications.
A multiclass confusion matrix is a powerful tool for evaluating the performance of a classification model that predicts more than two classes. It's like a scorecard that shows not only how many predictions were correct or incorrect, but also the types of errors the model is making. See the image below.

Each row in the matrix represents the actual class, while each column represents the predicted class. The diagonal elements show the number of correct predictions for each class, while the off-diagonal elements reveal the types of misclassifications. This detailed breakdown helps identify areas where the model excels or struggles, enabling targeted improvements and a deeper understanding of its behavior across different classes. The confusion matrix demonstrates that your object detection model performs well across most classes, accurately identifying cars, traffic lights, and to a good extent, people and trucks.
However, it faces some challenges with bicycles, which present a valuable opportunity for targeted improvement. The overall high accuracy underscores the model's potential for reliable and safe object detection in autonomous vehicles.
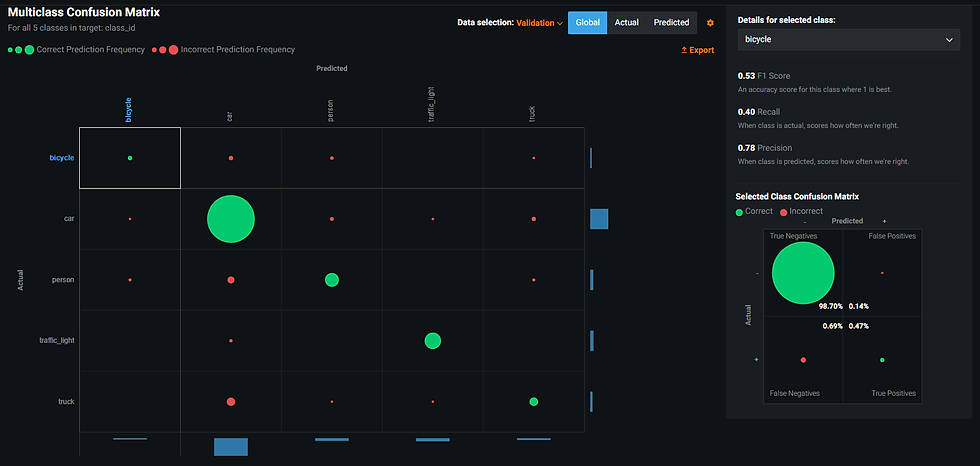
Elaborating more about the last observation, in the figure above the class ‘bicycle’ has been selected. Now, the confusion matrix reveals that while your model demonstrates reasonable accuracy in identifying bicycles, it struggles more, as could be expected, with correctly detecting all actual bicycles (person? car?) compared to other classes. This highlights a potential area for improvement, as failing to detect bicycles in a self-driving scenario could have safety implications. Further model refinement and data augmentation strategies could focus on improving the model's sensitivity to bicycles to enhance its overall performance and reliability.
In addition to the evaluation tools, DataRobot Visual AI also provides tools, such as Activation Maps, to help understand how the model is working. They highlight the specific regions of an image that are most influential in the model's decision-making process. This visual representation helps you understand which features or patterns the model is learning, increasing transparency and trust. Activation maps are particularly useful for debugging models, identifying biases, and explaining predictions, especially in critical applications like self-driving cars where understanding the AI's reasoning is paramount.

The image above shows an example of the model's misclassification of bicycles as persons stems from an overemphasis on the cyclist's upper body and a lack of attention to the bicycle itself. This suggests the need for more balanced training data and potentially incorporating features that specifically highlight the unique characteristics of bicycles. This insight can guide further model improvement and help mitigate potential biases, leading to more accurate and reliable object detection in self-driving scenarios.
Finally, the figure below illustrates one of the most powerful DataRobot AI tools, the Prediction Explanations

This Prediction Explanations chart demonstrates the power of DataRobot in providing transparency in AI decision-making. Highlighting the key features and their impact on the prediction, allows us to understand how the model accurately identified a bicycle in this specific instance. This level of insight is crucial for building trust in AI systems, especially in critical applications like self-driving cars, where understanding the model's reasoning is paramount for safety and reliability.
Conclusion
The analysis of our object detection model built with DataRobot's Visual AI reveals a powerful and insightful tool for autonomous vehicle applications. The model demonstrates high accuracy in identifying and locating key objects like cars, traffic lights, and pedestrians, crucial for safe and reliable self-driving. The insights gained from the lift chart, feature impact, feature effects, confusion matrix, activation maps, and prediction explanations provide a comprehensive understanding of the model's strengths and areas for potential improvement.
DataRobot empowers you to not only build high-performing AI models but also to understand and explain their behavior, fostering trust and transparency in this critical application. By leveraging DataRobot's Visual AI, you can unlock the potential of image data to create more intelligent and reliable autonomous vehicles, paving the way for a safer and more efficient future of transportation.
Want to experience the power of DataRobot Visual AI with your datasets? Contact us today for a free consultation and discover how DataRobot can accelerate your journey towards getting the most value out of your data.


Comments