Farmed vs. wild-caught salmon: a machine learning (computer vision) use case
- Angel Solutions (SDG)

- Aug 5, 2024
- 5 min read
Updated: Sep 30, 2024
Eating fish, particularly salmon, is recommended for all ages due to its easy digestibility and high content of omega-3 fatty acids, vitamins, and minerals. The increasing human population and health benefits of fish consumption are driving up the demand for fish.
Unsustainable fishing practices have depleted wild fish stocks, leading to food security concerns. In response, farmed fish are being offered as a sustainable alternative to meet increasing consumer demand.

Previously consumers generally perceived farmed fish as inferior to wild-caught (wild) fish. However, recent research indicates both farmed and wild salmon are equally valued by most consumers in the USA, Europe, and worldwide.

Consumer preference for wild versus farmed fish is influenced by various factors. For example, females often prefer farmed fish due to their involvement in cooking, while coastal populations tend to consume less farmed fish compared to inland populations.
Regardless of consumer preferences, let's consider a scenario where consumers are looking to purchase salmon. Whether they are walking in a supermarket aisle or shopping online, is it possible for them to determine if the offered product is farmed or wild fish (a binary classification task) based solely on its external appearance photo or image?
In a critical industrial setting, such as a salmon processing plant, where human errors during, for example, classification and packing operations can have costly consequences in terms of time and money, is it possible to quickly and automatically determine with confidence whether the handled product is farmed or wild fish based solely on images or photos?
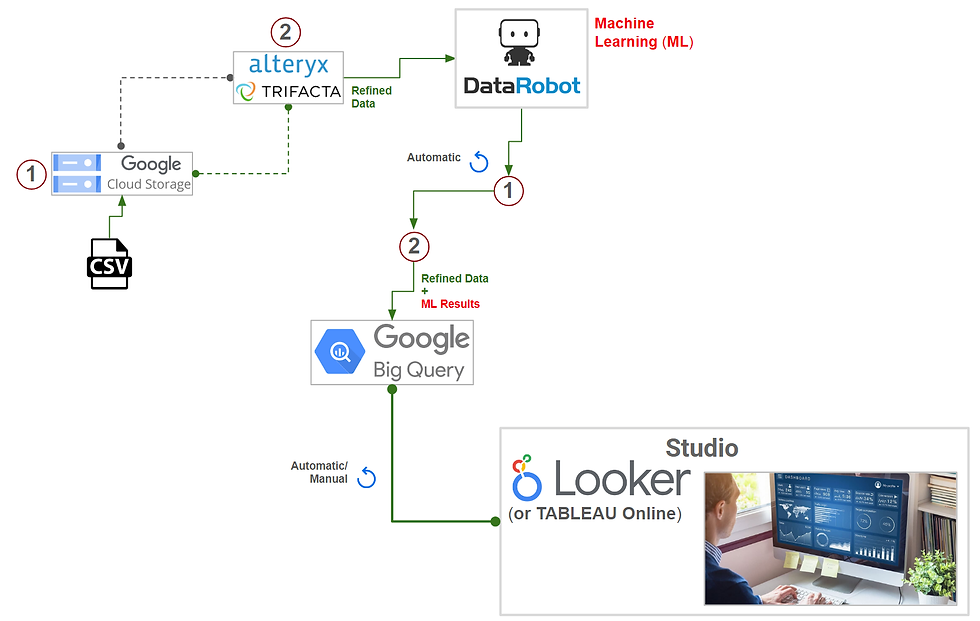
The answer to the previous question is "YES!" The image above illustrates the high-level architecture of a fully automated cloud-based analytics solution deployed in the Google Cloud Platform (GCP). This solution is specifically designed to handle this binary classification task. The best option to address this and other machine learning issues is the DataRobot AutoML platform, as mentioned in previous posts.
The dataset used to train the algorithm for this use case is sourced from Kaggle. It consists of images of salmon labeled as "FARMED" and "WILD". The images have not been cropped or preprocessed and were mostly captured by amateur photographers in various locations, including homes, supermarkets, and restaurants. The objective is to assess the effectiveness of the proposed workflow in a realistic scenario.


For a machine learning task that only involves images as input, the best method available in the DataRobot Platform is the Visual AI technology. Out of the dozens of models run and ranked by the platform in this experiment, the Elastic-Net Classifier (L2/Binomial Deviance) model was chosen. The image above displays the blueprint and its data flow, as well as a visualization of the neural network architecture unleashed by this algorithm to analyze the input images.
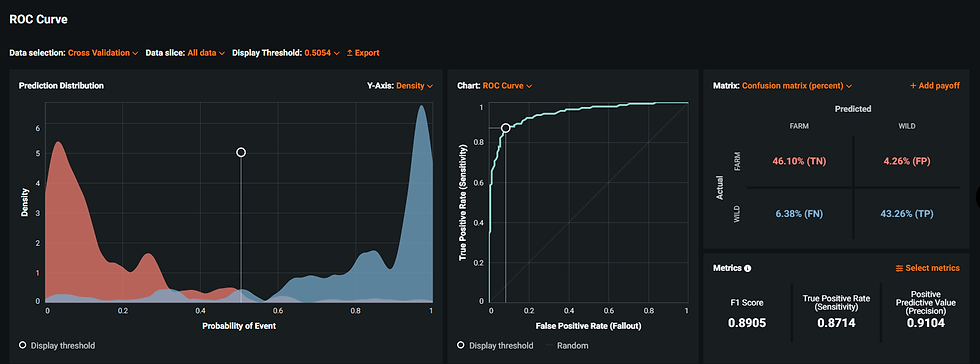
The figure below shows how well the model can classify: the probabilities of the events are evenly balanced around 0.5 (about half "FARMED" and half "WILD"); the Fallout and Sensitivity metrics have satisfactory values (check the plot in the middle); and there is a low percentage of False Positives (FP) and False Negatives (FN), namely, 4.26% and 6.38%, respectively. The goal is to have a rather conservative model, seeking to emulate human behavior as closely as possible.
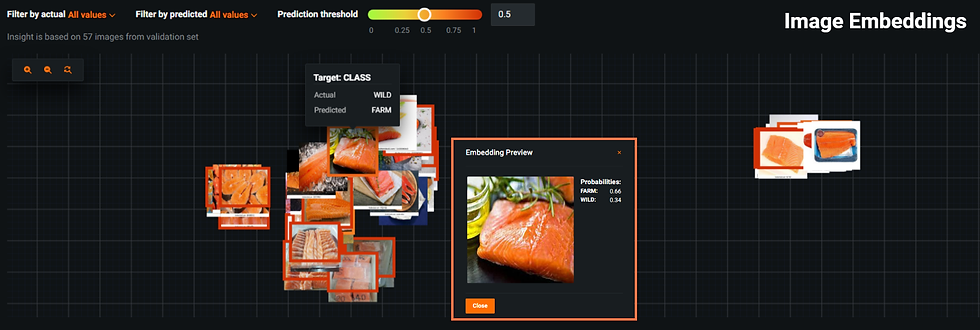
To showcase and understand the trained model, Visual AI provides Image Embeddings and Activation Maps tools. The two images below are examples of Image Embeddings: in the first, the actual class was WILD but it was misclassified as FARMED. Upon zooming in (highlighted in orange), it's clear that the input image contains several noisy features which could have affected the class prediction negatively.
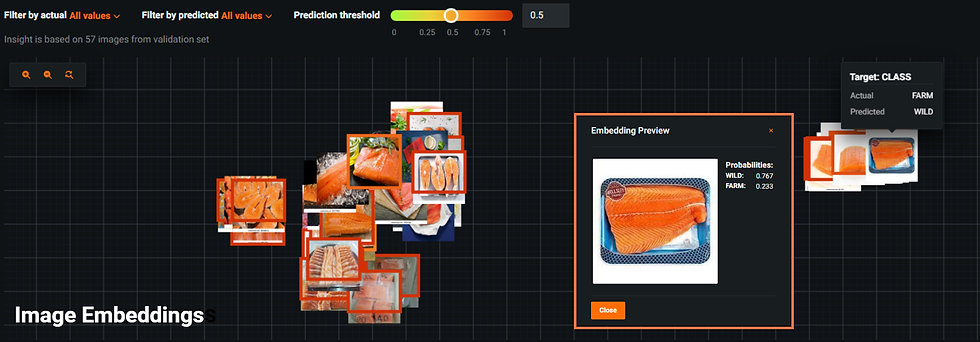
Now, in the second figure, the actual class was FARMED but it was misclassified as WILD. Upon zooming in (highlighted in orange), this image also contains noisy features which may negatively affect the class prediction.
On the other hand, the Activation Maps tool allows the display of sample images with color highlights indicating areas of high (red) and low (blue) activations. Please refer to the figure below. The areas colored in red were given more consideration by the neural network/deep learning algorithm to analyze the images and carry out the calculations. On the right of the picture, the same instances mentioned in the paragraph above, are again featured in orange rectangles. Once again, if the input photo contains undesirable features, it increases the likelihood of being misclassified even by powerful and sophisticated neural network/deep learning algorithms.

After analyzing and understanding the model, the next step is to use it to classify and predict the classes and determine the probabilities for a new dataset of 80 unlabeled, non-preprocessed images (not included in the training step). These images depict both farmed and wild-caught salmon. Although the classes ("FARMED"/"WILD") are not available, they are embedded in the file names and can be extracted.
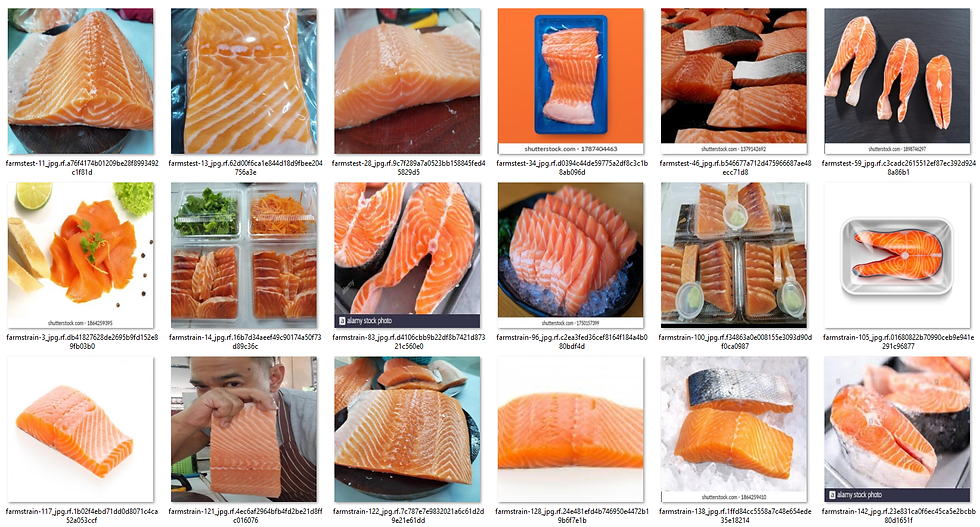
After completing the new dataset's classification task, the predicted labels and probabilities were exported. These were then combined with other relevant features, such as a link to the image, and the actual classes extracted from the 80 image file names. Additionally, a new column was added to label the prediction as "right" if the predicted class matches the actual, and "wrong" if it doesn't.
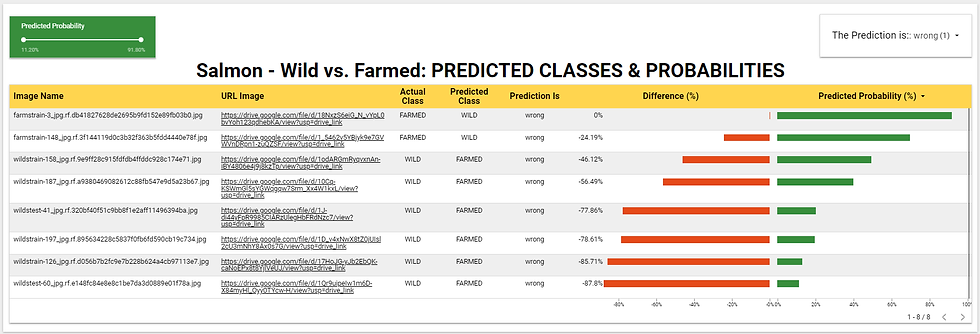
The dataset mentioned in the previous paragraph was connected to Google Looker Studio to create a dashboard, which is displayed in the image above. The dashboard features two filters that facilitate result analysis and extraction of actionable insights. The green bars illustrate the predicted probabilities, while the red bars represent the negative Difference (%) between the actual and predicted classes. A more negative value indicates a greater deviation of the predicted label from the actual one.
In the figure above, only the "wrong" predictions are shown, namely, when the model incorrectly classifies "FARMED" as "WILD" or vice versa. This misclassification occurred in only 8 out of 80 instances, which is 1 out of every 10, representing just a tenth of the sample. This demonstrates the good prediction power of the rather conservative model being considered. Certainly, enhancing the quality of the input data for model training and performing model fine-tuning will enhance the model's predictive capabilities.
Based on the earlier discussion and results, it is safe to assert that workflows incorporating DataRobot Visual AI technology can be promptly implemented in salmon processing plants. This includes applications in classification and packaging processes, as well as various other processes, to optimize operations and minimize the effects of potential human errors that could lead to costly consequences in terms of health, time, and money.
Angel Solutions (SDG) is a member of the Google Cloud Partner Advantage and a trusted partner of DATAMATE/DataRobot. Our teams consist of highly trained professionals equipped with the best AI-powered platform and tools to effectively handle and provide solutions for your data projects, regardless of type or volume.


Comments